A candidate-generation service I run answers gRPC requests with up to 2,000 candidates. Each candidate is an id and a map of six metadata strings, and the response is about 540 KB.
Cloud Profiler said 36.09% of that service’s CPU was inside grpc.encode. Not candidate search,
not data fetches, not ranking. A third of the machine was writing bytes.
I replaced the default codec with generated marshal methods from vtprotobuf. Encoding went from 2.296 ms to 0.306 ms on the same response, allocations from 72,002 to 1. The wire is untouched.
The rest is the why, and what it is worth.
Where the CPU went
The service runs with Cloud Profiler’s agent: ten sampled seconds a minute, plus an allocation profile. One day gave 604 CPU profiles and I merged 302, so the shares below are that day’s traffic mix rather than one busy minute.
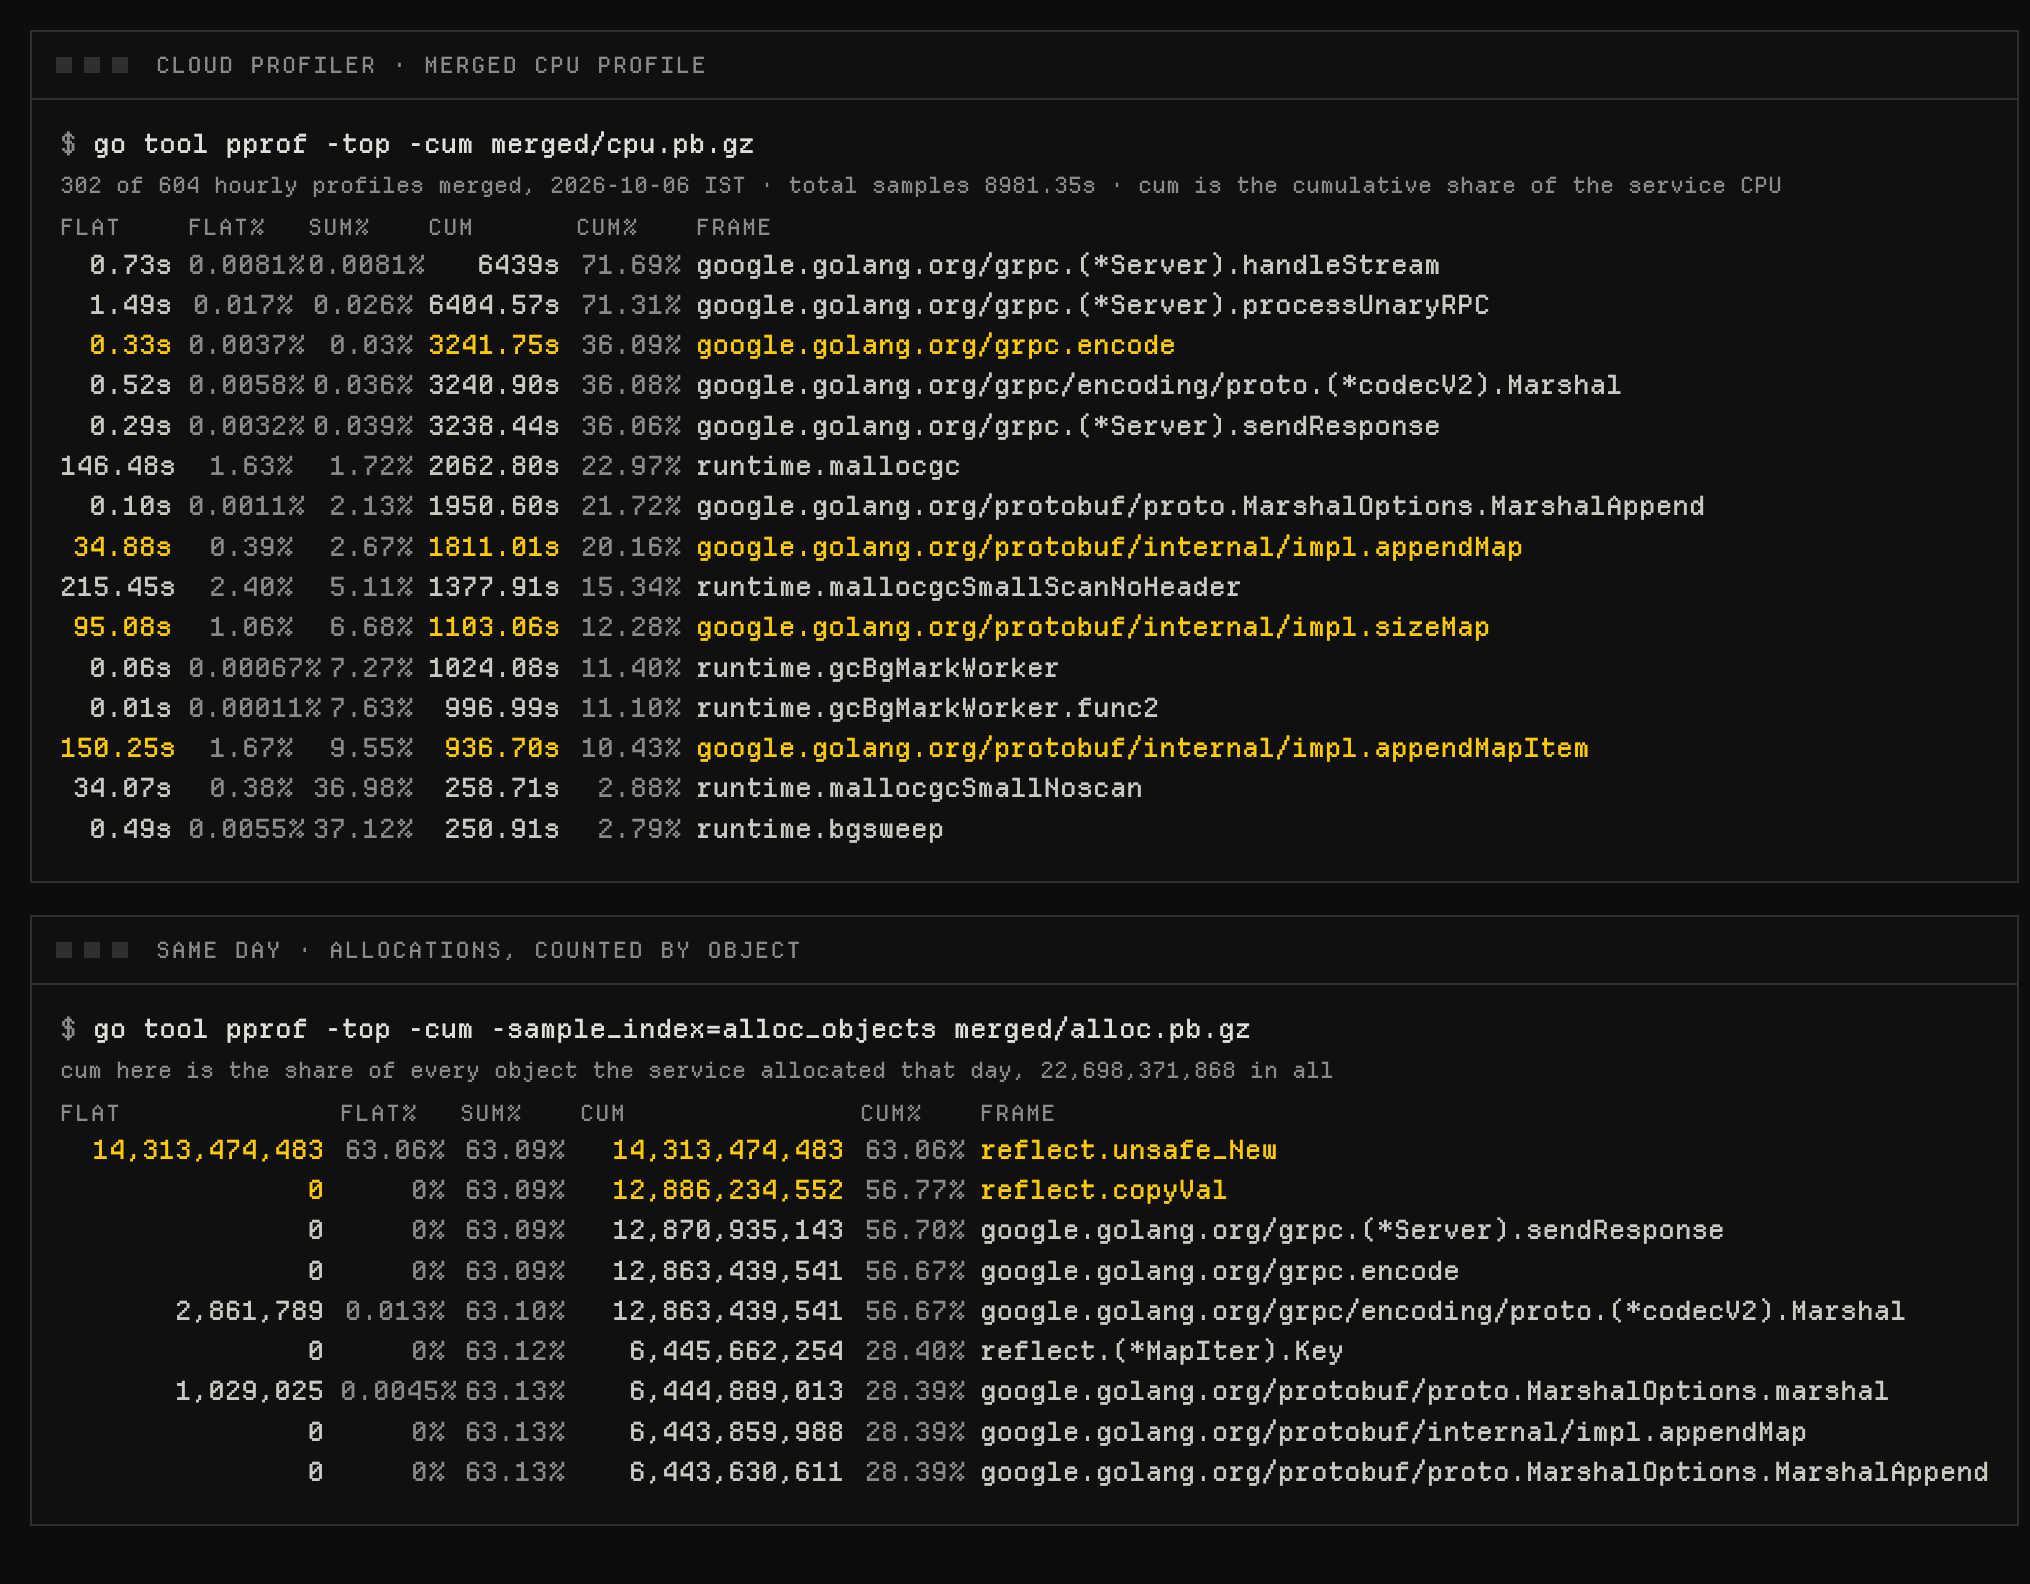
I read them with go tool pprof -top -cum and took cumulative shares, which answer “how much of the
service ran somewhere under this frame”. Shares overlap on purpose: grpc.encode is
36.09% and runtime.mallocgc is 22.97% because most of that
allocation happens inside the encoder.
| frame | share of CPU |
|---|---|
grpc.encode, the whole encode path |
36.09% |
runtime.mallocgc, allocating the buffers |
22.97% |
proto.MarshalOptions.MarshalAppend |
21.72% |
internal/impl.appendMap, writing map entries |
20.16% |
internal/impl.sizeMap, sizing them first |
12.28% |
runtime.gcBgMarkWorker and runtime.bgsweep |
14.19% |
internal/impl.appendMapItem, sizing each entry again as it writes it |
10.43% |
grpc.encode36.09% of all samples50.6% of its caller
The whole encode path: gRPC asks for a size, then for the bytes.
The allocation profile pins the rest. Of every object that service allocated that day,
56.67% came from inside the encoder, and 63.06%
from reflect.unsafe_New, the allocator reflect’s map iterator boxes keys and values through.
90.03% of its callers are reflect.copyVal, the iterator
itself.
The cost is per map entry
Each candidate carries a map<string, string> of six keys: a relevance score, a cursor, a catalog
id, a product id, a source tag, a rank. 2,000 candidates
hold 12,000 entries, and the entry count sets the cost, not the
byte count.
In the wire format an entry is a small nested message: a tag, a length, then the key and value, each
with their own. One relevance_score entry:
| bytes | meaning |
|---|---|
12 |
field 2, the map |
1c |
the entry is 28 bytes long |
0a 0f and 15 bytes |
key: "relevance_score" |
12 09 and 9 bytes |
value: "0.6509505" |
The awkward byte is 1c. The entry’s length precedes the bytes it describes, so a left-to-right
writer has to know it before writing the key. Same one level up, where a candidate’s length precedes
its id and map.
So an encoder sizes everything in one pass and remembers the sizes, or writes the buffer from the end and derives each length from what it has already written. Protobuf-go takes the first road. Generated code takes the second.
One metadata entry written two ways. The reflective codec measures every entry twice before writing anything, then writes front to back and allocates six objects per entry. The generated codec measures the message once, then writes from the end of the buffer toward the start, so every length is known from the bytes already written. Both end on the same 30 bytes.
Three walks and 72,002 allocations
Protobuf-go has no code written for this message type. The .pb.go file carries the struct and a
descriptor, and at startup the descriptor becomes a table of field offsets with a size or write
function per field.
One reflective engine serves every message type in the process, which is what keeps generated files small and dynamic messages, extensions and unknown fields working. That engine walks the candidate list three times for one response.
Walk 1 is gRPC’s, not the library’s. codecV2.Marshal calls proto.Size for the pooled
buffer. The engine visits every candidate, calls sizeMap per map, and caches each candidate’s size
in a hidden struct field.
Walk 2 exists because that size is not passed down. MarshalAppend sizes the message again
before writing it, and a map entry has nowhere to cache its length, so entries are sized here too.
Walk 3 writes and sizes again. appendMapItem computes the entry’s length, writes it, writes the
key and the value, then checks what it wrote matches. It also validates UTF-8.
Every walk iterates the map through reflect.Value.MapRange(), and every iter.Key() and
iter.Value() boxes a string header onto the heap. Two allocations per entry, per walk:
12,000 entries, three walks,
72,002 allocations and
1,175,041 bytes of garbage for one response. Sizing is
cheap. The reflective map iteration is not.
Write it backwards
vtprotobuf is a protoc plugin that writes one Go method
per message beside the .pb.go file. The methods are loops over the real fields: no reflection, no
per-entry boxing, no second size pass.
for k := range m.MetaData {              // generated, and a plain range over the real map
	v := m.MetaData[k]
	baseI := i
	i -= len(v)
	copy(dAtA[i:], v)                  // value bytes
	i = protohelpers.EncodeVarint(dAtA, i, uint64(len(v)))
	i--
	dAtA[i] = 0x12                     // value tag
	i -= len(k)
	copy(dAtA[i:], k)                  // key bytes
	i = protohelpers.EncodeVarint(dAtA, i, uint64(len(k)))
	i--
	dAtA[i] = 0xa                      // key tag
	i = protohelpers.EncodeVarint(dAtA, i, uint64(baseI-i)) // the entry's length: what was just written
	i--
	dAtA[i] = 0x12                     // the map's tag
}
The generated code writes from the end toward the start. By the time it writes an entry’s length,
every byte that length describes is already in the buffer, so the length is baseI - i, a subtraction
instead of another traversal. Fields go last to first, so the bytes land in the order a left-to-right
encoder produces.
The buffer comes out of gRPC’s pool at exactly the size SizeVT reported, and the pool reuses it
between responses. One allocation per response is left: gRPC’s wrapper around the pooled buffer,
283 bytes against 1.18 MB.
The codec decides per message, not per service. Messages with generated methods take the fast path. Everything else falls through to the codec that was replaced, so other proto files in the process and the service’s own calls to its dependencies keep the encoding they had.
How much faster
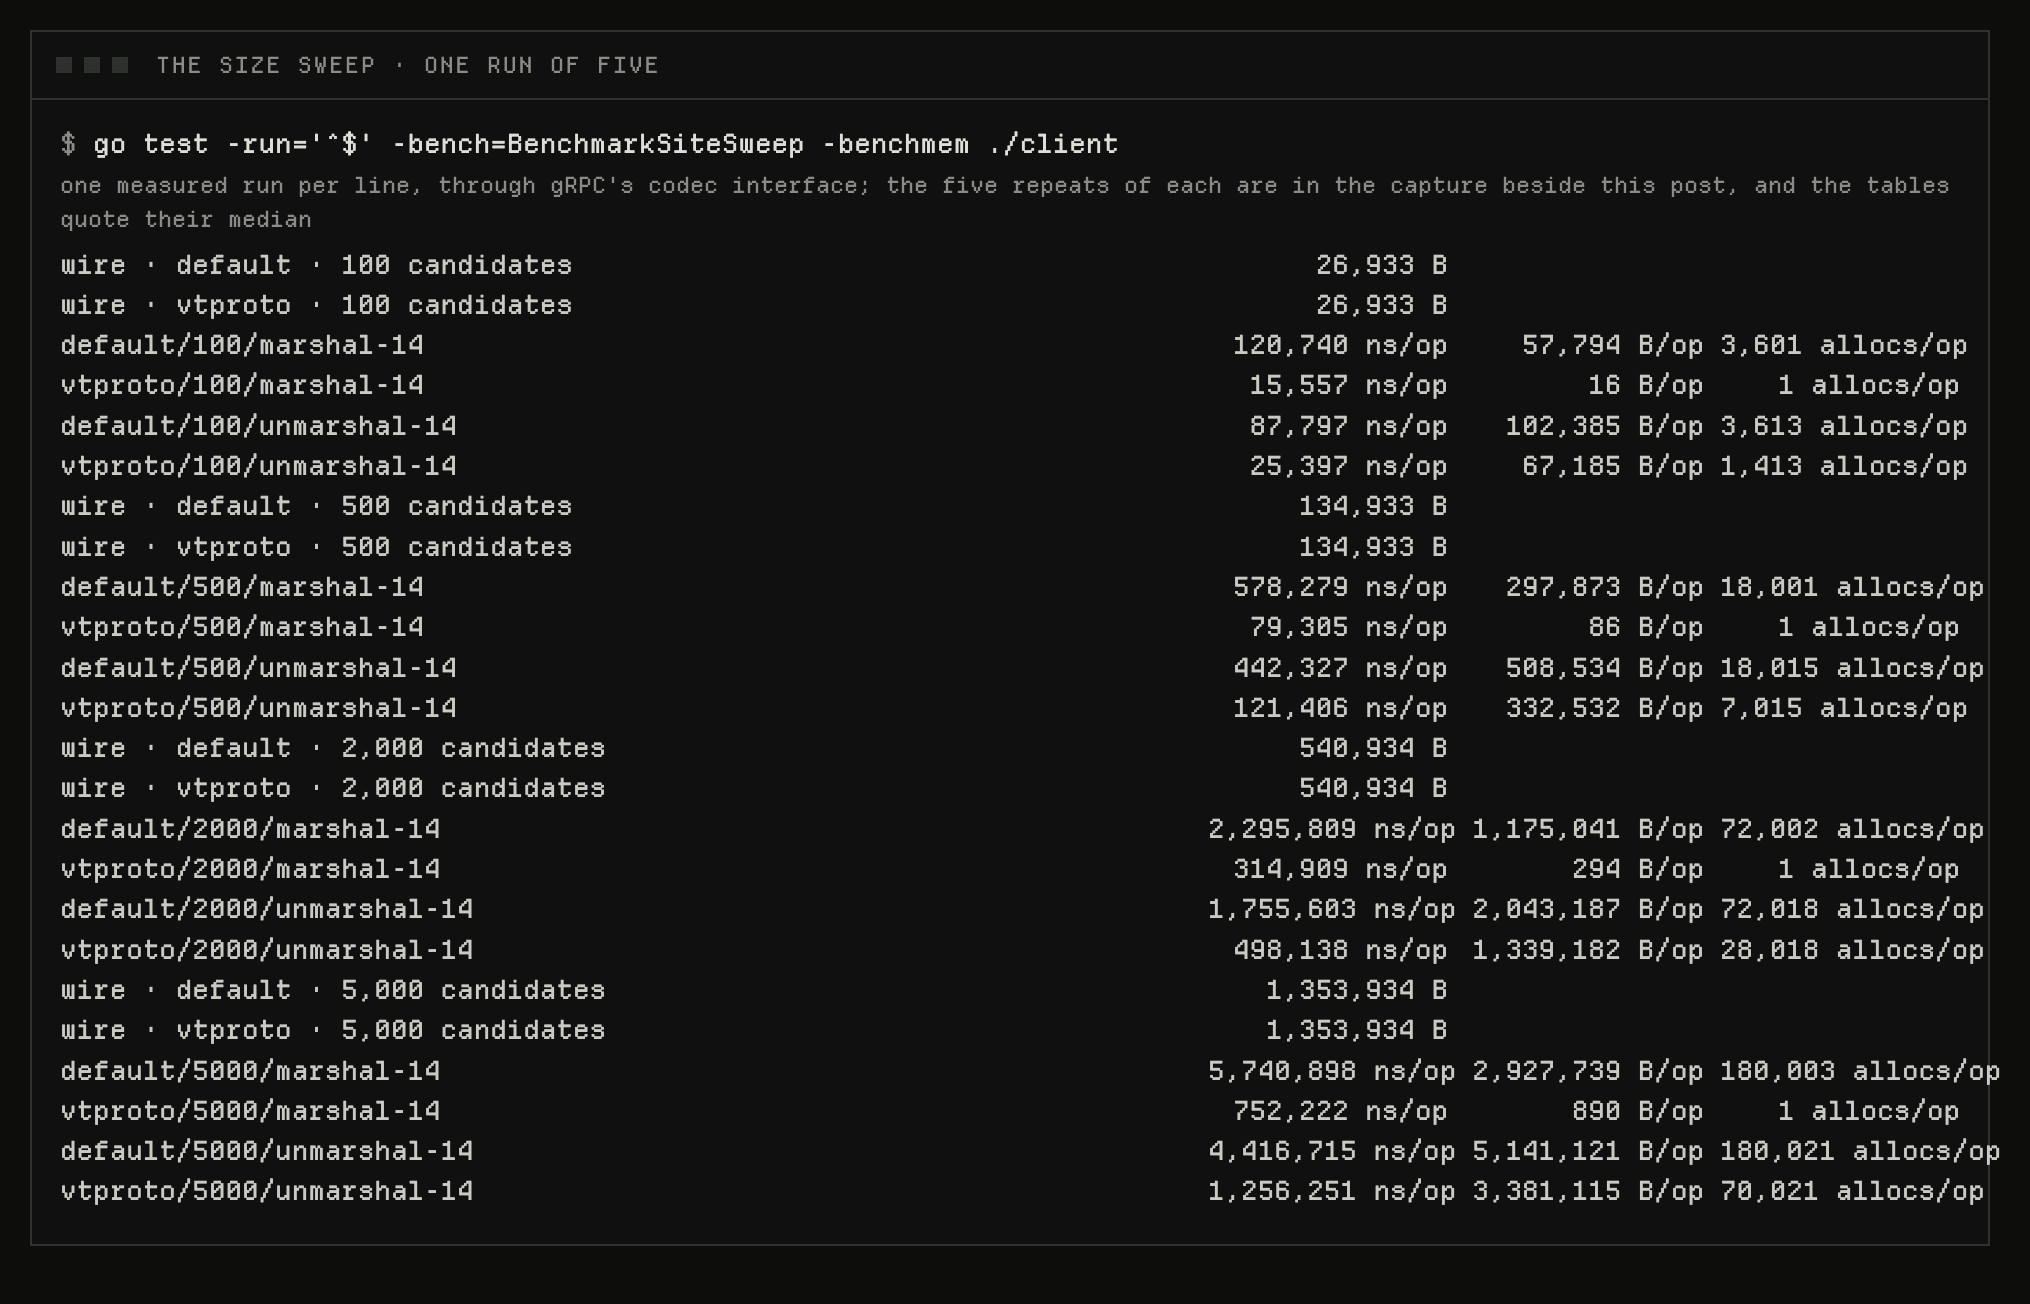
Both codecs through gRPC’s encoding.CodecV2 interface, four response sizes, five runs each, on an
Apple M4 Pro with Go 1.24.4. The explorer draws every run; the line is the median.
- protobuf-go
- vtprotobuf
2,000 candidates7.5× faster
protobuf-go · 2.296 ms median · 5 runs 2.290–2.299 msvtprotobuf · 0.306 ms median · 5 runs 0.303–0.315 ms
every run · protobuf-go 2.296 2.291 2.290 2.299 2.296 · vtprotobuf 0.315 0.306 0.303 0.307 0.304
Encoding is 7.5x faster and decoding 3.5x, constant across sizes because the saving is per map entry and entries scale with candidates.
Encode gains more because the generated encoder removes a whole pass and every allocation in it, while both decoders still allocate the key and value strings, which Go strings own. Decode’s floor is 28,018 allocations at 2,000 candidates; only a typed schema removes them.
The bytes on the wire do not change
Both encoders write the wire format, so the output is the same message. Three checks:
| check | result |
|---|---|
| Encoded length at 100, 500, 2,000 and 5,000 candidates, both codecs | same number at every size: 26,933, 134,933, 540,934, 1,353,934 bytes |
Messages encoded by one codec and decoded by the other, compared with proto.Equal: empty, one candidate, 2,000 candidates, a request with a field that has no generated methods, and a candidate with no metadata |
equal in every case, in both directions |
| A real gRPC call with the generated codec on the server only, the client only, and both | request and response equal in all three |
The second is the one that matters for a live service. Go iterates maps in a random order, so two encodes of the same response differ in byte order with the same library. What has to hold is that the parsed message is the same.
Two behaviours differ, neither of them wire format.
- A string field with invalid UTF-8 passes through the generated codec. Protobuf-go rejects it on
encode and on decode, with
string field contains invalid UTF-8. The generated codec copies the bytes and says nothing. Calls that fail today succeed, and no call that succeeds today starts failing. - Decoding into a message that already has data merges instead of clearing. gRPC always decodes into a fresh message, so this cannot happen in production, and a test pins that.
Turning it on
gRPC keeps one codec registry per process, and every RPC and client call looks up the codec named
proto. At startup the service calls a RegisterGRPCCodec() that reads one config key. vtproto
registers the new codec under that name; any other value, or none, keeps the default. The active codec
is logged, because a process-wide swap nobody can see is a bad thing to ship.
Two properties made this a config change instead of a migration.
- It is opt-in per process. The codec is registered at startup and never changes at runtime, so turning it on is a config change and a restart, and turning it off is the same.
- It is invisible to the schema. No
.protofile changes, no generated message changes, and the descriptor the service serves stays the same.
What it is worth
The saving is not one number. In the workload where the response is most of the job, 40.05% of CPU sits in the encoder and the codec gives back 38.4% of it. Where the CPU goes into similarity work and feature decoding, the encoder sits at the edge of the response and the saving is 2.8%.
Across the workloads that serve this shape, that is 65.8 of the 668.8 cores that serve it each day. The core totals come from Prometheus, and the profile shares above are what put a saving on them.
The busiest caller saves 37 of its own cores. It spends 11.06% of its CPU in gRPC’s proto unmarshal, and 99.51% of that time arrives through the client’s receive path, where a downstream response lands. The generated decoder removes 37 of the 469 cores it uses. That is a change in the caller’s own repository, made when that team wants it, because the wire format does not move.
What I got wrong
- Generating from the upstream proto repository produced code for a schema the service does not
run. The committed
.pb.gofiles carry fields no branch of that repository has. The fix was to generate from the descriptors those files register at startup, which is now a checked-in script: dump the descriptors, run the plugin,git diffcomes back empty. - The decoder will not approach the encoder’s speedup. Both decoders must allocate a string per key and per value, so the generated decoder removes the reflection and map machinery around those allocations, not the allocations.
What this does not show
- One service, one message shape. Every number here is a metadata-heavy response: many small string fields, a few thousand per message. A message of a few scalars gains far less, because the engine’s cost per field is small and its cost per map entry is not.
- No schema change, so no ceiling on decode. Typed metadata fields would remove the key and value strings, and that is a proto change with a much longer tail.
- No comparison with other generators.
gogoprotoand the newer codegen avoid the same reflection. I benchmarked one replacement, not the best one. - One normal day. Traffic mix and load move, and the profile shares of that day are what the saving arithmetic rests on.
The data
The captures are committed beside this post, and the tests recompute every number in it from them.
How it was measured
| part | what I did |
|---|---|
| Benchmarks | go test -bench -benchmem -count=5 through encoding.CodecV2, medians of the five runs, on an Apple M4 Pro with Go 1.24.4 |
| Benchmark message | 2,000 candidates, each an id and 6 metadata strings shaped like production output, 540,934 bytes on the wire |
| Libraries | google.golang.org/protobuf v1.36.6, google.golang.org/grpc v1.73.0, github.com/planetscale/vtprotobuf v0.6.1-0.20240319094008-0393e58bdf10 |
| Profiles | Google Cloud Profiler, 302 of 604 hourly CPU profiles for one day merged, plus that day’s heap allocation profiles |
| Profile read | go tool pprof -top -cum, cumulative shares; encode is everything under grpc.encode, decode is the proto unmarshal frames, GC is runtime.gcBgMarkWorker plus runtime.bgsweep |
| Cores | Prometheus container_cpu_usage_seconds_total, 5-minute rates summed over the workloads that serve this shape, for one day |
| Caller side | Each caller’s own merged CPU profile, decode taken as the cumulative share under the proto unmarshal frame, and the part of it that arrives through the client receive path reported separately |
| Parity | Wire sizes compared at every benchmarked size, cross-decoding compared with proto.Equal, and a gRPC call with the new codec on one side only, all from the codec’s own test suite |
The medians, every size
| candidates | on the wire | encode, default | encode, generated | decode, default | decode, generated |
|---|---|---|---|---|---|
| 100 | 26,933 B | 0.118 ms | 0.016 ms | 0.089 ms | 0.025 ms |
| 500 | 134,933 B | 0.579 ms | 0.079 ms | 0.438 ms | 0.121 ms |
| 2,000 | 540,934 B | 2.296 ms | 0.306 ms | 1.765 ms | 0.498 ms |
| 5,000 | 1,353,934 B | 5.742 ms | 0.751 ms | 4.428 ms | 1.256 ms |
Allocations per response
| candidates | encode, default | encode, generated | decode, default | decode, generated |
|---|---|---|---|---|
| 100 | 3,601 | 1 | 3,613 | 1,413 |
| 500 | 18,001 | 1 | 18,015 | 7,015 |
| 2,000 | 72,002 | 1 | 72,018 | 28,018 |
| 5,000 | 180,003 | 1 | 180,022 | 70,021 |
Allocations per operation, as reported by the benchmark harness. Encoding’s count is 36 per candidate plus two: six keys, two allocations per key per walk, three walks.